Should you buy in Oakland or San Francisco? If you are weighing space, commute, and lifestyle against price, you are not alone. Choosing the right side of the Bay comes down to product type, neighborhood priorities, and what your budget can comfortably support. In this guide, you will see the key differences in prices, property types, commute options, and ongoing costs, so you can move forward with clarity. Let’s dive in.
Big picture price and space
Citywide snapshots show a clear price gap. Recent reports place San Francisco’s median sale price around 1.2 to 1.4 million dollars, while Oakland trends near 660 to 700 thousand dollars. Price per square foot also differs, with San Francisco commonly in the 800 to 950 dollars per square foot range and Oakland around 400 to 550 dollars per square foot. These are broad medians that shift month to month with the mix of condos and single-family homes.
Key takeaway: You usually trade some space for location and walkability in San Francisco, while Oakland often delivers more square footage and yards at a lower total price.
When you compare price per square foot, keep it apples to apples. Compare the same product type in similar locations and time windows. For a quick refresher on why this metric can mislead, review this guide on how price per square foot works and where it falls short.
What your budget buys
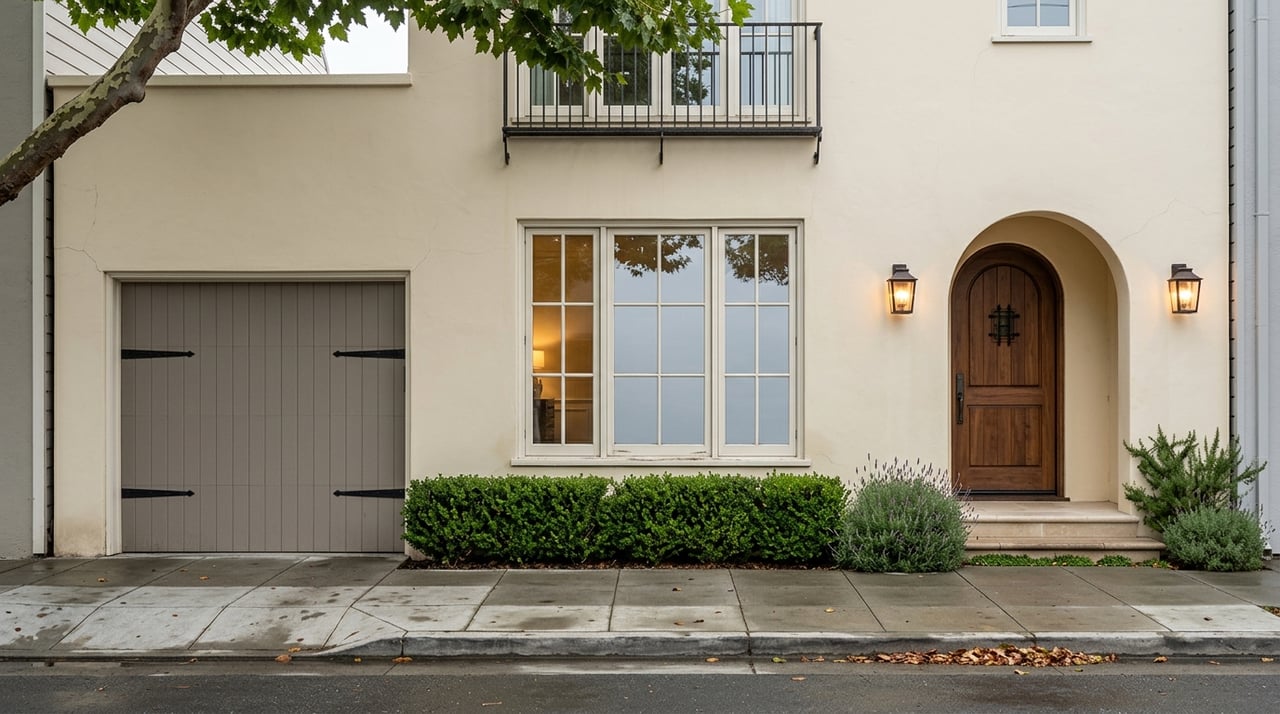
- In San Francisco, many listings are condos, TICs, or flats in multi-unit buildings. You pay for proximity to jobs, transit, and amenities, with smaller footprints and limited private outdoor space in many neighborhoods.
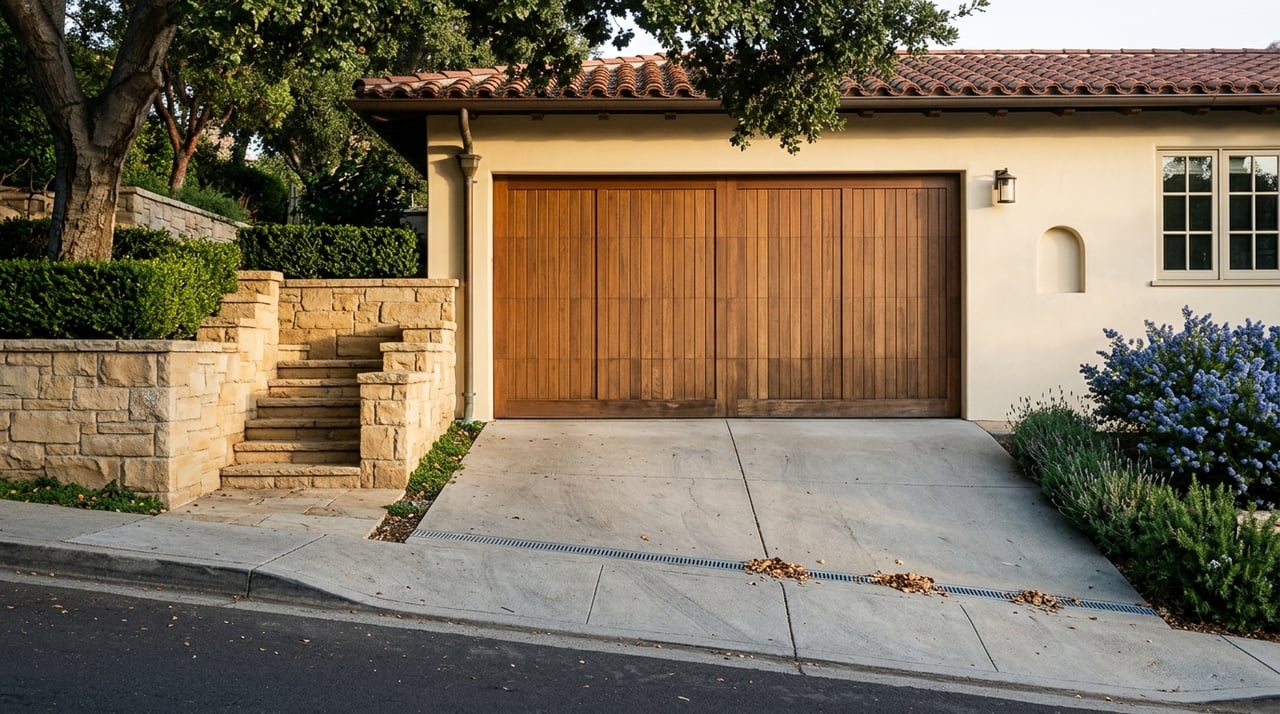
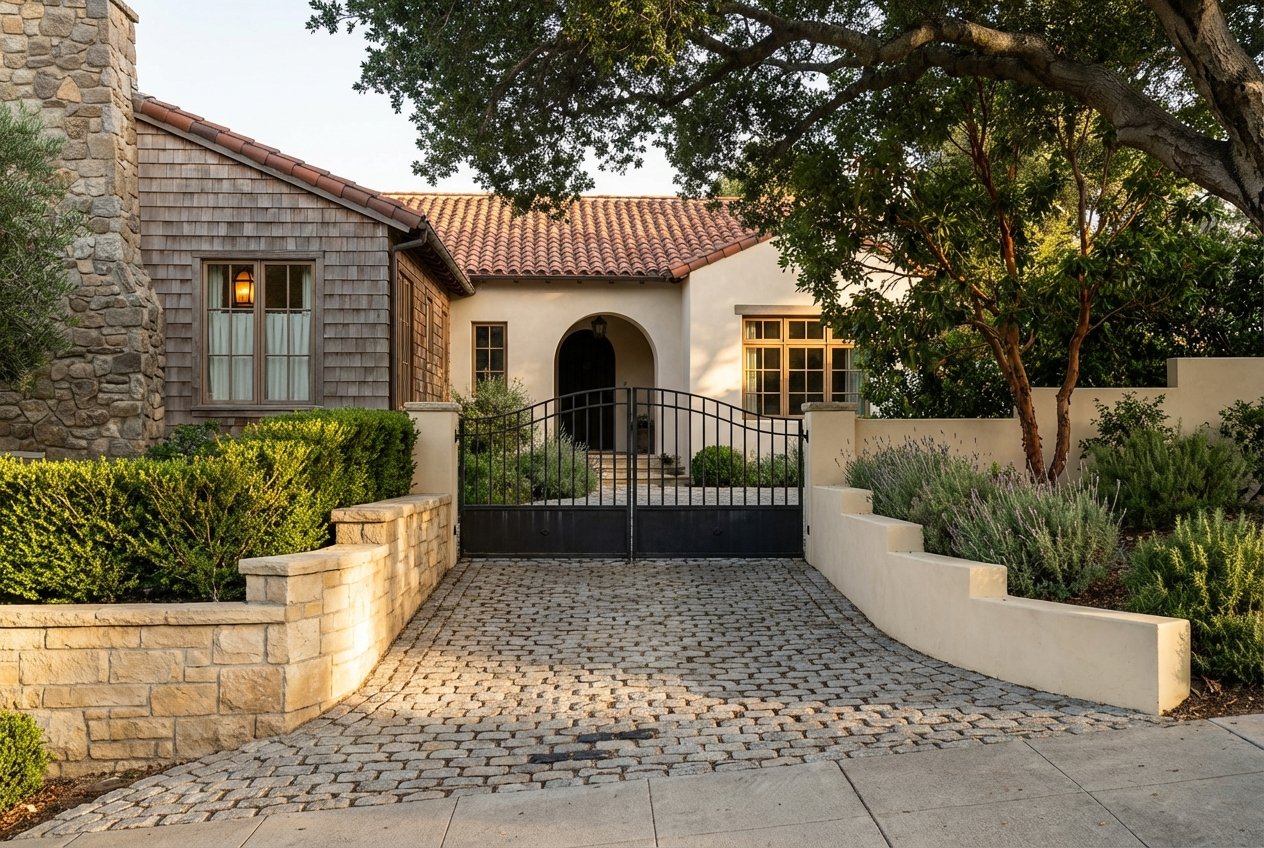
- In Oakland, you will find a wider mix, from condos near BART to larger single-family homes in the hills and foothills. For the same budget, you often gain more interior space, a yard, or parking.
Property types and ownership patterns
Ownership rates and housing stock shape your options. According to U.S. Census QuickFacts, San Francisco has a lower owner-occupancy rate, around 38 percent, and a higher median value for owner-occupied homes, roughly 1.39 million dollars. Oakland shows a higher owner-occupancy rate, around 42 percent, and a lower median owner value, roughly 930 thousand dollars. You can explore the city snapshots on San Francisco QuickFacts and Oakland QuickFacts.
Population density also matters for lifestyle. San Francisco is much denser, about 18,600 people per square mile, compared with Oakland’s roughly 7,900. Denser areas tend to have more multi-unit buildings and stronger transit access, while lower-density areas more often feature detached homes with yards.
Condo vs single-family reality
- San Francisco: more vertical living, frequent HOA fees, and higher parking constraints. Buyers value walkability, transit frequency, and views.
- Oakland: broader variety, including single-family homes with lot size and garages, plus condo and townhome options near BART and downtown.
If you want space for the same budget, Oakland often wins. If you prioritize car-light living with frequent transit, San Francisco often leads.
Commute and transit tradeoffs
BART is the cross-bay backbone. In-vehicle times from downtown Oakland stations to downtown San Francisco typically land in the low teens of minutes, though door-to-door depends on your walk, transfer, and last-mile steps. Plan exact station pairs with the BART trip planner.
Ferries are a comfortable option from Oakland and Alameda to the Ferry Building. On-water times commonly run about 25 to 40 minutes depending on terminal and vessel. For a practical overview of routes and modes, see this guide to getting from Oakland to San Francisco.
Driving varies widely. An uncongested hop between downtowns can be 20 to 30 minutes, but peak periods often add significant delays at the Bay Bridge, plus a westbound toll. Always plan door-to-door, including parking or drop-off.
Door-to-door examples to test
- Rockridge to Montgomery Street: BART is usually the fastest and most predictable choice. Check your exact departure and transfer with the BART trip planner.
- Lakeshore to the Ferry Building: The ferry is a pleasant option for a laptop commute. Confirm schedule and terminal options using the mode overview in the Oakland to San Francisco guide.
Neighborhood feel and walkability
San Francisco is among the most walkable and transit-friendly cities in the country, and many daily needs can be met on foot or via frequent buses and rail. Oakland offers a mix, with highly walkable pockets like Uptown, Rockridge, and Temescal, plus quieter, lower-density neighborhoods with yards. For a national context on city walkability and transit access, review this walkability roundup.
Safety context and research
Safety conditions change by micro-location and time. For current San Francisco trends and neighborhood-level views, use the SFPD Crime Dashboard. For Oakland, check official police reports and city dashboards when evaluating a specific block or route. Because conditions vary, compare the most recent data and visit at different times of day.
Taxes and ongoing ownership costs
In California, base property tax is 1.00 percent of assessed value under Proposition 13, with voter-approved bonds and local assessments added on top. Effective rates in both San Francisco and Alameda County commonly fall near 1.00 to 1.25 percent depending on the tax-rate area. For an overview, see this primer on how Proposition 13 works. Condo HOA fees, parking costs, and insurance needs vary by property and will affect your total monthly outlay.
How to decide with confidence
Use a simple framework to narrow your search:
- Fix the product type. Compare condo to condo or single-family to single-family.
- Anchor to a transit node or commute path. Map BART, ferry, and driving routes for your typical week.
- Pick a consistent data window. Compare 30, 90, or 365-day medians for the same period.
- Validate the feel. Walk the neighborhood, test errands, and time your commute during peak periods.
- Model the monthly. Add HOA dues, taxes, insurance, and likely parking to your mortgage estimate.
When you balance price, space, and commute, your best fit often becomes clear. If you want more yard and square footage, Oakland can shine. If you want car-light living with frequent transit, San Francisco can be a great match.
Data notes and timing
Data sources accessed February 16, 2026. City medians and schedules change regularly. For current city snapshots, consult Census QuickFacts for demographics and travel times, the BART trip planner and the Oakland to San Francisco transit overview for routes, the walkability roundup for city-level context, and the SFPD Crime Dashboard for recent safety trends.
Ready to weigh specific neighborhoods and properties side by side? I pair data with on-the-ground insight to help you buy confidently or sell for a strong result. Reach out to Analise Smith-Hinkley to schedule a consultation.
FAQs
What is the headline price gap between Oakland and San Francisco?
- Recent snapshots show San Francisco’s median sale price around 1.2 to 1.4 million dollars, while Oakland trends near 660 to 700 thousand dollars, with shifts based on month and product mix.
How do average commutes compare for residents in each city?
- Mean travel times are similar in the low 30-minute range for both cities, reflecting many different origin and destination pairs across the region.
How long is a typical BART ride from downtown Oakland to downtown San Francisco?
- In-vehicle times often land in the low teens of minutes between downtown stations; check exact timing with the BART trip planner.
Is San Francisco or Oakland more walkable for daily errands?
- San Francisco ranks among the nation’s most walkable cities on many roundups, while Oakland includes highly walkable pockets and lower-density neighborhoods; see this walkability roundup for context.
How do California property taxes impact buyers in both cities?
- Both cities follow Proposition 13, which sets a 1.00 percent base tax plus local assessments, leading to effective rates commonly near 1.00 to 1.25 percent; review this Prop 13 primer.
Where can I check recent safety trends before choosing a neighborhood?
- For San Francisco, use the SFPD Crime Dashboard; for Oakland, review official city and police reports and visit neighborhoods at various times of day.